
South African electricity · interactive analyses
Stories from the grid, told with the data.
Each piece starts from primary sources: Eskom's hourly station data, the published Integrated Resource Plans, Stats SA. The charts are live. Hover, switch views, drag the sliders. Methods and assumptions sit at the foot of every page.
-
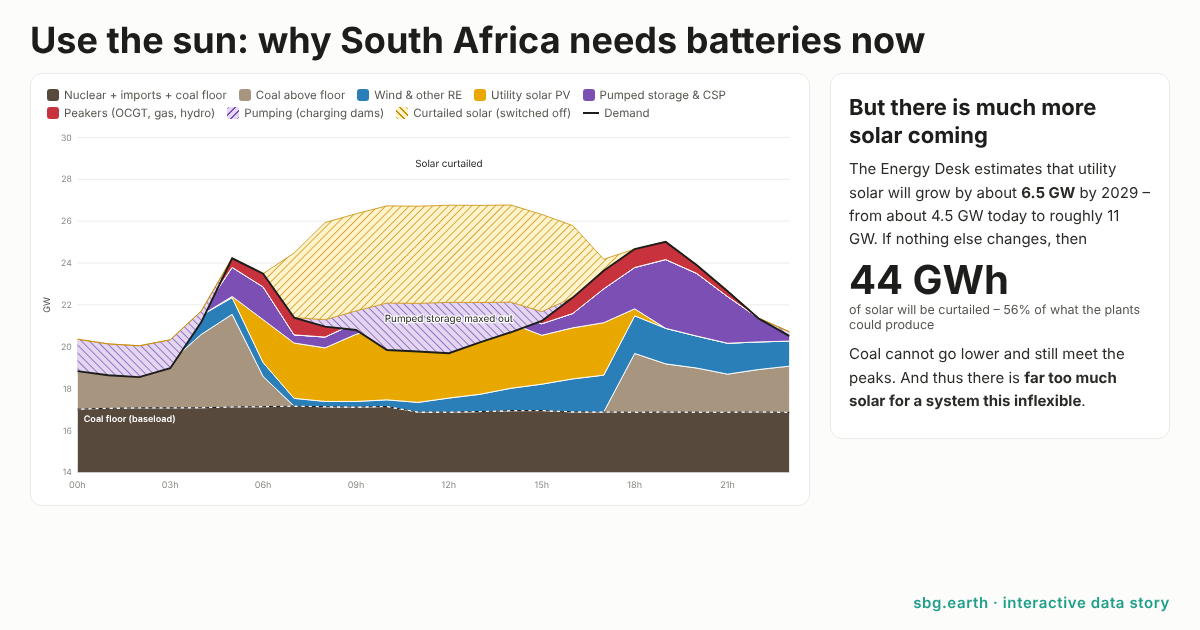
Use the sun: why South Africa needs batteries now
On a sunny spring day in 2029, with the utility solar already in the pipeline, more than half of it could be switched off. Built on Eskom's hourly data for 30 October 2026: curtailment, the coal floor, and what batteries change. Build your own fleet with the slider.
56%of utility solar curtailed on a sunny day by 2029, if nothing else changesOpen the story -
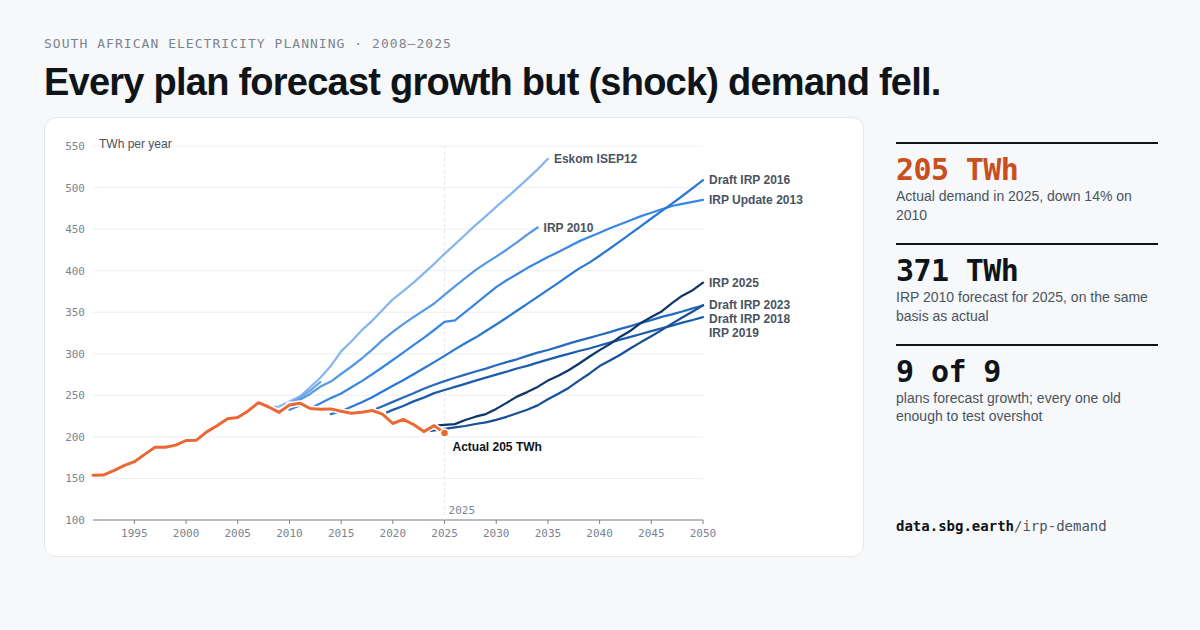
Every plan forecast growth but (shock) demand fell.
Nine national demand forecasts, from Eskom's ISEP12 in 2008 to IRP 2025, drawn against what the grid actually delivered. Rebase each plan to its own base year, or read them as published, and compare central cases with the full scenario spread.
−14%actual demand in 2025 against 2010, while every plan projected growthOpen the chart
About
Analysis by Frank Spencer, sbg.earth, Cape Town. Twenty years in renewables; now working on the data behind South Africa's energy transition.
Use and attribution
Figures are indicative and open to review. Quote freely with a link back to the page; the sources and assumptions are listed on each one. Questions and corrections: frank@sbg.earth.